Logarithm Connections

1. Look up the world's population on Wikipedia and use the following links to graph the year against population from 1750 to present, on both plain graph paper and logarithmic graph paper. See how the exponential curve becomes a line. What does the slope of the line of your log graph represent? Does it correlate to anything in the text of the article? Predict the population of the earth in the year 2075. On which graph can you make a more accurate prediction? Compare your result with the prediction from the following website by a "group of experts" at the United Nations.
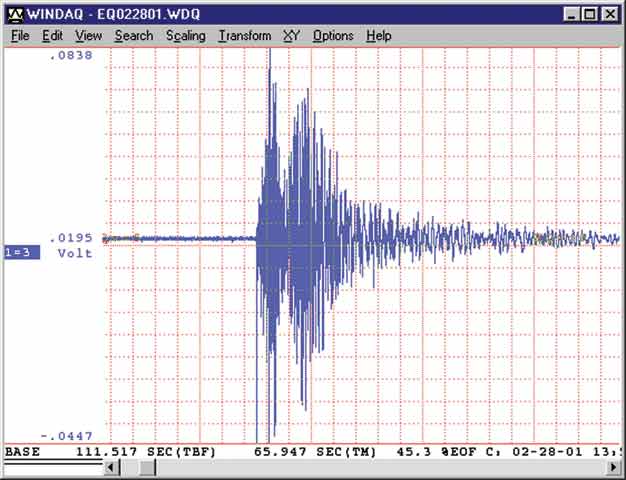
2. Research the 1994 Northridge Earthquake in Southern California. Compare the initial "Richter Scale" magnitude with that of the aftershocks. Determine how much more intense the main quake was than the larger aftershocks to help explain why the aftershocks did not cause as much damage as the main quake even though the Richter Scale measurements are close in magnitude.