Slavery Economics
 Once
the colonies were established, colonial leaders faced a long-term problem. If
they were to become rich, they had to recruit a labor force. Acquiring land was
easy for a man of means, since land in America was so plentiful. But acquiring
labor was a constant problem. The small farmer could rely on his family but a
man with broad acres needed extra hands.
Once
the colonies were established, colonial leaders faced a long-term problem. If
they were to become rich, they had to recruit a labor force. Acquiring land was
easy for a man of means, since land in America was so plentiful. But acquiring
labor was a constant problem. The small farmer could rely on his family but a
man with broad acres needed extra hands.
One possible source was obviously the Indian. And
colonists repeatedly tried to enslave the Indian. As late as 1708 South Carolina
held 1,400 red men in bondage as compared to 4,100 Africans. But colonists found
that enslaving the Indian was more trouble than it was worth. In any case, the
supply of Indian force was minute compared to the need. So the colonists looked
to England and indentured servitude. But it was not until after 1700 that
slavery began to displace white servitude as the most significant form of forced
labor. Especially in the southern colonies, where large-scale commercial
agriculture was the way of life, slaves became the
work force on many plantations. Almost before the
colonies realized it, they had built a society and economy that was profoundly
dependent on human bondage. By 1750, the largest single stream of immigration
into British North America was composed of black slaves from Africa. And by
1860, a little more than half of the population of the southern states was
composed of black slaves.
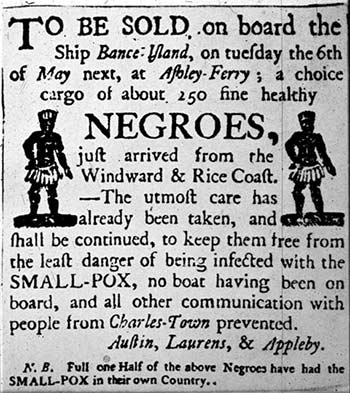
Slavery is fundamentally an economic phenomenon. Throughout
history, slavery has existed where it has been economically worthwhile to those
in power. The principal example in modern times is the U.S. South. Nearly 4
million slaves with a market value of close to $4 billion lived in the U.S. just
before the Civil War. Masters enjoyed rates of return on slaves comparable to
those on other assets; cotton consumers, insurance companies, and industrial
enterprises benefited from slavery as well. Such valuable property required
rules to protect it, and the institutional practices surrounding slavery display
a sophistication that rivals modern-day law and business....
Slavery never generated superprofits, because people always
had the option of putting their money elsewhere. Nevertheless, investment in
slaves offered a rate of return -- about 10 percent -- that was comparable to
returns on other assets. Slaveowners were not the only ones to reap rewards,
however. So too did cotton consumers who enjoyed low prices and Northern
entrepreneurs who helped finance plantation operations.
TABLE 1
Population of the Original Thirteen Colonies, selected years by type
|
1750
|
1750
|
|
1790
|
1790
|
|
1790
|
1810
|
|
1810
|
1810
|
1860
|
|
1860
|
1860
|
State
|
|
White
|
Black
|
|
White
|
Free
|
|
Slave
|
White
|
|
Free
|
Slave
|
White
|
|
Free
|
Slave
|
|
| |
|
|
|
Nonwhite
|
|
|
|
|
Nonwhite
|
|
|
|
Nonwhite
|
|
|
|
108,270
|
3,010
|
|
232,236
|
2,771
|
|
2,648
|
255,179
|
|
6,453
|
310
|
451,504
|
|
8,643
|
-
|
Connecticut
|
|
27,208
|
1,496
|
|
46,310
|
3,899
|
|
8,887
|
55,361
|
|
13,136
|
4,177
|
90,589
|
|
19,829
|
1,798
|
Delaware
|
|
4,200
|
1,000
|
|
52,886
|
398
|
|
29,264
|
145,414
|
|
1,801
|
105,218
|
591,550
|
|
3,538
|
462,198
|
Georgia
|
|
97,623
|
43,450
|
|
208,649
|
8,043
|
|
103,036
|
235,117
|
|
33,927
|
111,502
|
515,918
|
|
83,942
|
87,189
|
Maryland
|
|
183,925
|
4,075
|
|
373,187
|
5,369
|
|
-
|
465,303
|
|
6,737
|
-
|
1,221,432
|
|
9,634
|
-
|
Massachusetts
|
|
26,955
|
550
|
|
141,112
|
630
|
|
157
|
182,690
|
|
970
|
-
|
325,579
|
|
494
|
-
|
New Hampshire
|
|
66,039
|
5,354
|
|
169,954
|
2,762
|
|
11,423
|
226,868
|
|
7,843
|
10,851
|
646,699
|
|
25,318
|
-
|
New Jersey
|
|
65,682
|
11,014
|
|
314,366
|
4,682
|
|
21,193
|
918,699
|
|
25,333
|
15,017
|
3,831,590
|
|
49,145
|
-
|
New York
|
|
53,184
|
19,800
|
|
289,181
|
5,041
|
|
100,783
|
376,410
|
|
10,266
|
168,824
|
629,942
|
|
31,621
|
331,059
|
North Carolina
|
|
116,794
|
2,872
|
|
317,479
|
6,531
|
|
3,707
|
786,804
|
|
22,492
|
795
|
2,849,259
|
|
56,956
|
-
|
Pennsylvania
|
|
29,879
|
3,347
|
|
64,670
|
3,484
|
|
958
|
73,214
|
|
3,609
|
108
|
170,649
|
|
3,971
|
-
|
Rhode Island
|
|
25,000
|
39,000
|
|
140,178
|
1,801
|
|
107,094
|
214,196
|
|
4,554
|
196,365
|
291,300
|
|
10,002
|
402,406
|
South Carolina
|
|
129,581
|
101,452
|
|
442,117
|
12,866
|
|
292,627
|
551,534
|
|
30,570
|
392,518
|
1,047,299
|
|
58,154
|
490,865
|
Virginia
|
| |
|
|
|
|
|
|
|
|
|
|
|
|
|
|
|
|
934,340
|
236,420
|
|
2,792,325
|
58,277
|
|
681,777
|
4,486,789
|
|
167,691
|
1,005,685
|
12,663,310
|
|
361,247
|
1,775,515
|
United States
|
| |
|
|
|
|
|
|
|
|
|
|
|
|
|
|
|
Source: Historical Statistics of the U.S. (1970), Franklin (1988).
Slavery in the South
Throughout colonial and antebellum history, U.S. slaves lived primarily in
the South. Slaves comprised less than a tenth of the total Southern population
in 1680 but grew to a third by 1790. At that date, 293,000 slaves lived in
Virginia alone, making up 42 percent of all slaves in the U.S. at the time.
South Carolina, North Carolina, and Maryland each had over 100,000 slaves. After
the American Revolution, the Southern slave population exploded, reaching about
1.1 million in 1810 and over 3.9 million in 1860.
TABLE 2
Population of the South 1790-1860 by type
|
Year
|
White
|
Free Nonwhite
|
Slave
|
| |
|
|
|
|
1790
|
1,240,454
|
32,523
|
654,121
|
|
1800
|
1,691,892
|
61,575
|
851,532
|
|
1810
|
2,118,144
|
97,284
|
1,103,700
|
|
1820
|
2,867,454
|
130,487
|
1,509,904
|
|
1830
|
3,614,600
|
175,074
|
1,983,860
|
|
1840
|
4,601,873
|
207,214
|
2,481,390
|
|
1850
|
6,184,477
|
235,821
|
3,200,364
|
|
1860
|
8,036,700
|
253,082
|
3,950,511
|
Source: Historical Statistics of the U.S. (1970).
Slave Ownership Patterns
TABLE 3
Slaves as a Percent of the Total Population
selected years, by Southern state
| |
1750
|
1790
|
1810
|
1860
|
|
State
|
Black/total
|
Slave/total
|
Slave/total
|
Slave/total
|
| |
population
|
population
|
population
|
population
|
| |
|
|
|
|
|
Alabama
|
|
|
|
45.12
|
|
Arkansas
|
|
|
|
25.52
|
|
Delaware
|
5.21
|
15.04
|
5.75
|
1.60
|
|
Florida
|
|
|
|
43.97
|
|
Georgia
|
19.23
|
35.45
|
41.68
|
43.72
|
|
Kentucky
|
|
16.87
|
19.82
|
19.51
|
|
Louisiana
|
|
|
|
46.85
|
|
Maryland
|
30.80
|
32.23
|
29.30
|
12.69
|
|
Mississippi
|
|
|
|
55.18
|
|
Missouri
|
|
|
|
9.72
|
|
North Carolina
|
27.13
|
25.51
|
30.39
|
33.35
|
|
South Carolina
|
60.94
|
43.00
|
47.30
|
57.18
|
|
Tennessee
|
|
|
17.02
|
24.84
|
|
Texas
|
|
|
|
30.22
|
|
Virginia
|
43.91
|
39.14
|
40.27
|
30.75
|
| |
|
|
|
|
|
Overall
|
37.97
|
33.95
|
33.25
|
32.27
|
Sources: Historical Statistics of the United States (1970), Franklin (1988).
TABLE 4
Holdings of Southern Slaveowners
by states, 1860
|
State
|
Total
|
Held 1
|
Held 2
|
Held 3
|
Held 4
|
Held 5
|
Held 1-5
|
Held 100-
|
Held 500+
|
| |
slaveholders
|
slave
|
slaves
|
Slaves
|
slaves
|
slaves
|
slaves
|
499 slaves
|
slaves
|
| |
|
|
|
|
|
|
|
|
|
|
AL
|
33,730
|
5,607
|
3,663
|
2,805
|
2,329
|
1,986
|
16,390
|
344
|
-
|
|
AR
|
11,481
|
2,339
|
1,503
|
1,070
|
894
|
730
|
6,536
|
65
|
1
|
|
DE
|
587
|
237
|
114
|
74
|
51
|
34
|
510
|
-
|
-
|
|
FL
|
5,152
|
863
|
568
|
437
|
365
|
285
|
2,518
|
47
|
-
|
|
GA
|
41,084
|
6,713
|
4,335
|
3,482
|
2,984
|
2,543
|
20,057
|
211
|
8
|
|
KY
|
38,645
|
9,306
|
5,430
|
4,009
|
3,281
|
2,694
|
24,720
|
7
|
-
|
|
LA
|
22,033
|
4,092
|
2,573
|
2,034
|
1,536
|
1,310
|
11,545
|
543
|
4
|
|
MD
|
13,783
|
4,119
|
1,952
|
1,279
|
1,023
|
815
|
9,188
|
16
|
-
|
|
MS
|
30,943
|
4,856
|
3,201
|
2,503
|
2,129
|
1,809
|
14,498
|
315
|
1
|
|
MO
|
24,320
|
6,893
|
3,754
|
2,773
|
2,243
|
1,686
|
17,349
|
4
|
-
|
|
NC
|
34,658
|
6,440
|
4,017
|
3,068
|
2,546
|
2,245
|
18,316
|
133
|
-
|
|
SC
|
26,701
|
3,763
|
2,533
|
1,990
|
1,731
|
1,541
|
11,558
|
441
|
8
|
|
TN
|
36,844
|
7,820
|
4,738
|
3,609
|
3,012
|
2,536
|
21,715
|
47
|
-
|
|
TX
|
21,878
|
4,593
|
2,874
|
2,093
|
1,782
|
1,439
|
12,781
|
54
|
-
|
|
VA
|
52,128
|
11,085
|
5,989
|
4,474
|
3,807
|
3,233
|
28,588
|
114
|
-
|
| |
|
|
|
|
|
|
|
|
|
|
TOTAL
|
393,967
|
78,726
|
47,244
|
35,700
|
29,713
|
24,886
|
216,269
|
2,341
|
22
|
Source: Historical Statistics of the United States (1970).
(Source:
http://cghs.dadeschools.net/slavery/antebellum_slavery/economics/beginnings.htm
and
http://eh.net/encyclopedia/article/wahl.slavery.us)